• OpenEEmeter Methods
    • OpenEEmeter Process
    • OpenEEmeter Compliance
    • Project Updates
    • Technical Working Group >
      • Technical Appendix
      • Issues and Evidence
    • OpenEEmeter History
    • Stakeholders
  • LFE OpenEEmeter
    • OpenEEmeter Overview
    • Github Code
    • EEweather
    • Documentation
  • FLEXmeter
    • GRIDmeter
    • Energy Differential Privacy
  • Contact
OpenEEmeter
  • OpenEEmeter Methods
    • OpenEEmeter Process
    • OpenEEmeter Compliance
    • Project Updates
    • Technical Working Group >
      • Technical Appendix
      • Issues and Evidence
    • OpenEEmeter History
    • Stakeholders
  • LFE OpenEEmeter
    • OpenEEmeter Overview
    • Github Code
    • EEweather
    • Documentation
  • FLEXmeter
    • GRIDmeter
    • Energy Differential Privacy
  • Contact

Updates to Monthly and Daily Methods & Documentation

2/23/2018

1 Comment

 
Week Three CalTRACK Update
As week 3 comes to a conclusion, we continue to “Test Monthly and Daily Methods”. Here are a few updates that have occurred this week and some early weather data visualizations. (Click links to GitHub)
Methods Updates:
  1. Nearest-neighbor interpolation for determining weather value estimates
    • Due to a limited number of available weather stations, there have been suggestions to interpolate weather data using the “nearest-neighbor approach”
    • Employing an interpolation method may provide a more accurate estimate on weather value for units in our dataset. However, there are concerns about the standard errors on interpolated data, its computation requirements, and the issue of missing data when applied to interpolated methods
    • At this point, our discussion has not reached a resolution. We will provide more information on the progress of this discussion when it is available
Documentation Updates:
To ensure effective communication, it is important that we are precise with our vocabulary and identification. Please read these updates to ensure that we are consistent in our discussions and documentation.
  1. We have three distinct definitions for the word “month”
  • Month as a period of time (e.g 12 months): In this case, we are using month as a unit to describe a period of time. Because months vary in length, it is recommended to use more specific time period units, such as day periods. For example, best practice for referring to 12 months would 365 day periods.
  • Month as calendar month: If the objective is to refer to a month more generally and not as a unit to measure time periods, please use the the term “calendar month”
  • Month as a billing period: Month is occasionally used synonymously with the term “billing period”. This is not advised because billing periods typically contain a different number of days and start and end on different dates than months. To avoid this ambiguity, use the term billing period when referring to the time interval between billings.

    2.  Distinction between data sufficiency and test data preparation requirements
  • In the documentation for data cleaning and preparation, some of the methods apply exclusively to test data and others may apply to general data sufficiency methods.
  • Best practice: define specifications that are intended for general data sufficiency in a separate “General Data Sufficiency” documentation. Otherwise, add the specification to the documentation for which it applies.

    3.  Distinction between data sufficiency in baseline and reporting period data
  • Certain methods only require baseline data and other methods require data from the reporting period
  • There is some ambiguity about sufficiency requirements for baseline and the reporting period data
  • Our goal is to define sufficiency requirements for baseline and reporting period data, then designate the data sufficiency requirements for each method
Below are plots of all the weather stations in several states (New York, Texas, Illinois, Colorado, and California). You can see that California actually has three weather patterns, but in the other states, the weather is remarkably consistent across the state. The next question will be, how much do the variations in the weather matter? (scroll through slides to see differences)
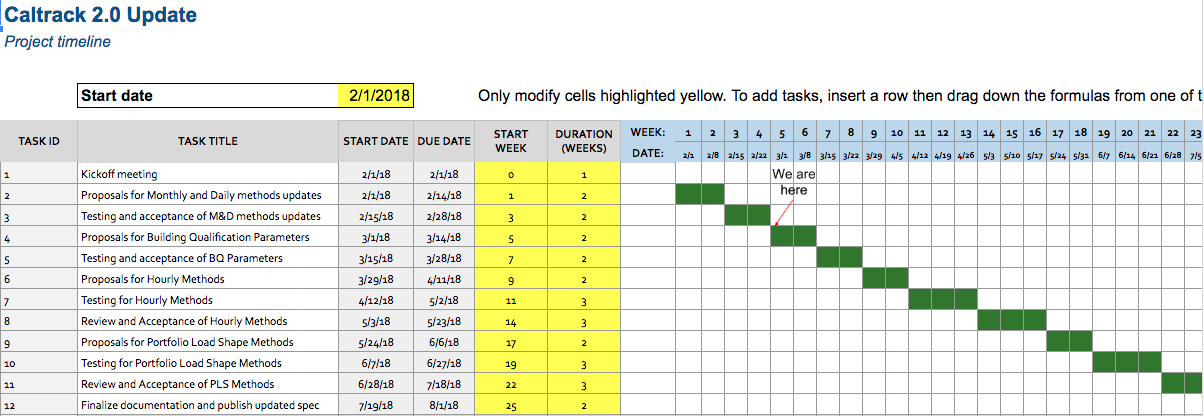
As we enter week 4 (starting 2/26), we will continue to accept data from testing of “Monthly and Daily Methods”. Starting on Wednesday (2/28), we will begin accepting proposals for “Building Qualification Parameters. We look forward to reviewing your test results on GitHub!
Homework:
  • Test the monthly and daily methods with your own data
  • Share results on GitHub with a description of data characteristics
  • Continue to contribute to discussions on GitHub Issues on monthly and daily methods and building qualification parameters
  • Working Group Meeting on 3/1
Picture
1 Comment

Proposed Testing for Monthly & Daily Methods

2/19/2018

0 Comments

 
Week Two CalTRACK Update
Picture
As we complete Week Two (2/12-2/16), we conclude our discussion of “Proposals for Monthly and Daily Methods Updates” and begin testing proposed methods. Here are the six main updates to the daily and monthly methods (click links to jump to GitHub):

Criteria for choosing weather stations
  • There is still deliberation regarding this topic. CalTrack 1.0’s methods chose weather station based on the closest weather station in a unit’s climatic zone.
  • An evaluation of weather station quality should be included in weather station mapping because data quality varies between weather stations

Adjustment to monthly data for models
  • To simplify the data preparation requirements for monthly modeling, we are proposing an alternate model that accounts for the variability of days in a bill cycle by using a customer’s average daily energy use per month in models
​
Defining maximum baseline period
  • When defining a baseline, too many months of data may positively bias energy usage. To address this, we would like to provide guidance for defining a maximum time period for a more precise definition of the baseline
  • Our strategy to investigate the effects of differing baseline periods is to compare test results after running models with a baseline that contains 12, 15, 18, 21, and 24 months of data
​
Include search grid to determine balance points on Monthly Methods
  • Previously, we only used search grid to determine balance points in Daily Methods. We plan to expand this to Monthly Methods in CalTrack 2.0
​
Expand Balance Point Search Range
  • From previous data analysis, we determined that the range of allowed values when selecting balance points may have been too restrictive for more severe climates.
  • We intend to expand the balance point range as much as possible without causing inflated standard errors
​
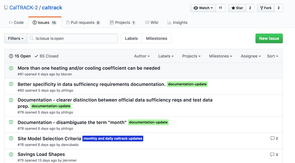
Site Model Selection Criteria
  • We plan to simplify our model selection process. Instead of filtering out all models with insignificant coefficients, we plan to evaluate the best fit models before filtering potentially insignificant results

In this upcoming week (starting 2/19), we look forward to beginning the testing process for our daily and monthly methods! We are encouraging participants to test models on their own data and share results on the GitHub. Please include information about data characteristics with the results.

Homework:
  • Test the monthly and daily methods with your own data
  • Share results on GitHub with a description of data characteristics
  • Continue to contribute to discussions on GitHub Issues

If you missed last weeks meeting, feel free to review it below at your leisure:

Watch the Video
0 Comments

CalTRACK 2.0 Kick-Off Meeting

2/2/2018

0 Comments

 
Picture
Thank you to everyone for contributing to a very successful kick off meeting yesterday! 

As promised - here is your homework in preparation for the next meeting.  Let us know if you have any trouble getting to these links.  

2/1/2018 Homework: 
1.) Register on GitHub - CalTRACK-2;
2.) Review CalTRACK.org and http://docs.caltrack.org for past content and decisions;
3.) Respond to doodle poll for new standing meeting time; and
4.) Post specific issues on GitHub CalTRACK-2 - Issues
 
Catch up:
If you missed the meeting – you can view it here: 

CalTRACK 2.0 Kick off meeting​
0 Comments

      Sign Up for Technical Working Group Updates

    Subscribe to Newsletter
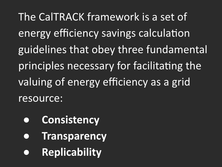
    The purpose of this blog is to provide a high-level overview of CalTrack  progress.
    ​
    For a deeper understanding or to provide input on technical aspects of CalTrack, refer to the GitHub issues page (
    https://github.com/CalTRACK-2/caltrack/issues). 
    Recordings
    2019 CalTRACK Kick Off:

    CalTRACK 2.0 
    July 19, 2018
    June 28, 2018
    June 7, 2018
    May 24, 2018
    May 3, 2018
    April 12, 2018
    March 29, 2018
    March 15, 2018
    March 1, 2018
    ​
    February 15, 2018
    February 1, 2018

    Archives

    April 2024
    March 2024
    February 2024
    January 2024
    November 2023
    October 2023
    September 2023
    August 2023
    June 2023
    May 2023
    April 2023
    March 2023
    February 2023
    January 2023
    December 2022
    November 2022
    July 2019
    March 2019
    February 2019
    August 2018
    July 2018
    June 2018
    May 2018
    April 2018
    March 2018
    February 2018

    RSS Feed

Powered by Create your own unique website with customizable templates.
  • OpenEEmeter Methods
    • OpenEEmeter Process
    • OpenEEmeter Compliance
    • Project Updates
    • Technical Working Group >
      • Technical Appendix
      • Issues and Evidence
    • OpenEEmeter History
    • Stakeholders
  • LFE OpenEEmeter
    • OpenEEmeter Overview
    • Github Code
    • EEweather
    • Documentation
  • FLEXmeter
    • GRIDmeter
    • Energy Differential Privacy
  • Contact