
|
Week Twenty-Two CalTRACK Update Last week marked the final CalTRACK 2.0 working group meeting. In this meeting we discussed an update to hourly methods, an overview of our progress during CalTRACK 2.0, and suggestions for CalTRACK 3.0. You can view the final meeting at following link: Hourly Methods Update: Empirical testing has shown correlation between energy consumption and season in residential buildings, that can have an effect on the savings error. The CalTRACK 2.0 working group has proposed accounting for this seasonal effect by shortening the 12-month baseline period to 3-month weighted baseline periods. The figure below shows the effect of shortening baseline periods to 3-month on Normalized Mean Bias Error (NMBE) for residential buildings. 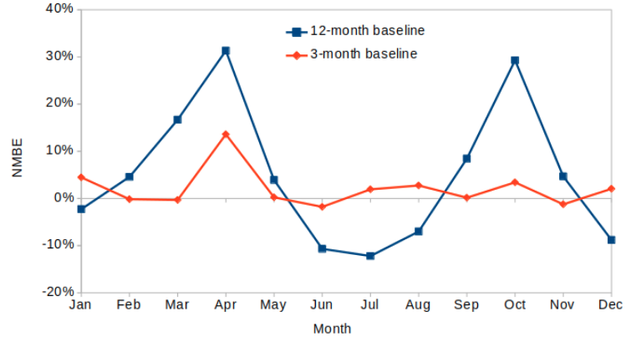 However, shortening an annual baseline to 3-month weighted baselines may not be necessary for all building types. Notably, commercial buildings tend to have a smaller seasonal effect than residential buildings, and may not experience increased NMBE from using a 12-month baseline period. The working group has established the following NMBE thresholds to define buildings that require 3-month weighted baselines and those where an annual baseline period is acceptable.
CalTRACK 2.0 Recap: Since February, the CalTRACK 2.0 process has tackled several major issues. Below is a quick synopsis of the major tasks addressed and outcomes for these topics.  Task 1: Updates to CalTRACK daily and billing methods based on feedback from CalTRACK 1.0 users. Some updates include:
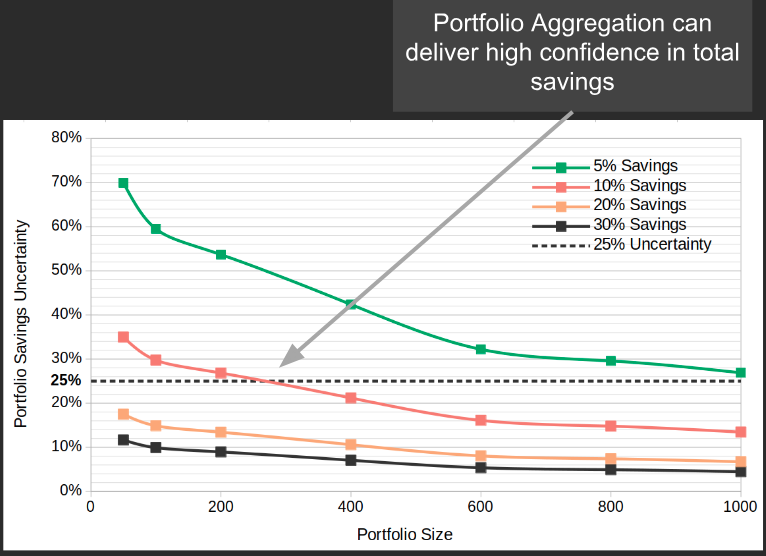 Task 2: Assess the feasibility of a portfolio aggregation approach for calculating savings as well as any effects on savings uncertainty.
Task 3: Develop a prototype method for calculating hourly savings.
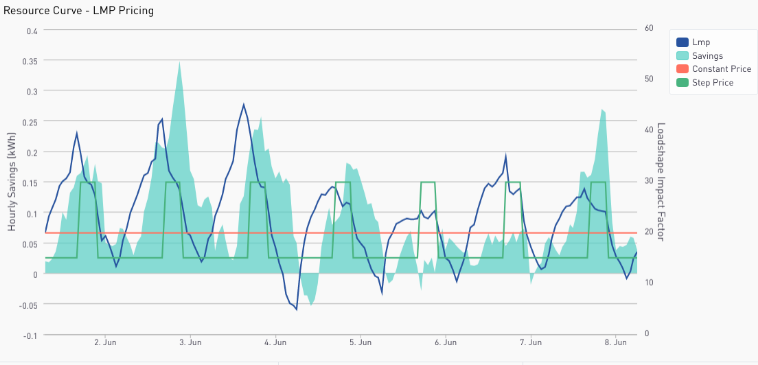
Task 4: Demonstrate how price signals can adjust the value of hourly load shapes to match procurement needs.
 CalTRACK 3.0: The direction of CalTRACK 2.0 methods development was guided by feedback from use cases that required “payable savings”. For example, PG&E’s pay-for-performance energy efficiency program decided to increase compensation for energy savings during peak hours during the second iteration of their program. This required CalTRACK 2.0 to develop methods that generate savings estimates at the hourly level. Similarly, we expect CalTRACK 3.0’s tasks will be guided by the demands of stakeholders that implement programs using CalTRACK 2.0 methods. In addition, we have designed a CalTRACK 3.0 sandbox on GitHub to document issues that require further investigation. We encourage working group members to continue adding ideas to the CalTRACK 3.0 sandbox as they arise. Homework:
0 Comments
Leave a Reply. |
The purpose of this blog is to provide a high-level overview of CalTrack progress.
For a deeper understanding or to provide input on technical aspects of CalTrack, refer to the GitHub issues page (https://github.com/CalTRACK-2/caltrack/issues). Recordings
2019 CalTRACK Kick Off:
CalTRACK 2.0 July 19, 2018 June 28, 2018 June 7, 2018 May 24, 2018 May 3, 2018 April 12, 2018 March 29, 2018 March 15, 2018 March 1, 2018 February 15, 2018 February 1, 2018 Archives
March 2024
|
 RSS Feed
